


jittawit.21/iStock via Getty Images
Fast Facts and Strategy
The State Street SPDR Portfolio Long Term Corporate Bond ETF (SPLB) was launched on March 10, 2009, and tracks the Bloomberg U.S. Long Term Corporate Bond Index. SPLB has a total expense ratio of 0.04%, a yield to maturity of 6.57%, and a trailing 12-month yield of 5.91%. Distributions are paid monthly. It is a large and very liquid ETF with $1.18 billion in assets under management (“AUM”) and $59 million in average daily volume. The fund’s issuer, State Street Corporation (STT), is a major financial services and bank holding company. Its asset management division, State Street Investment Management, has over $6 trillion in total AUM.
As State Street describes in the prospectus, the underlying index focuses on US corporate bonds with a maturity of at least 10 years. It includes investment-grade, fixed-rate, taxable, US dollar-denominated debt with at least $300 million of par amount outstanding, issued by US and non-US companies. The index is market-value weighted, rebalanced monthly, and contains over 3000 securities. The fund invests at least 80% of its asset value in a representative sample of the index, and may also hold other fixed income instruments, cash, and derivatives. The portfolio turnover rate was 16% in the most recent fiscal year. I will use the iShares iBoxx $ Investment Grade Corporate Bond ETF (LQD) as a benchmark.
Portfolio
The portfolio composition is based on data available on October 9, 2026. It may have changed by the time you read this.
The fund has over 2900 holdings, with about 89% of asset value in debt of US companies. SPLB is significantly less exposed to financials (16%) than LQD (27%, most of it in banks).
Sector Breakdown (State Street)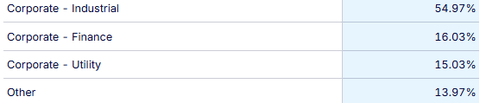
SPLB is on par with the benchmark regarding exposure to the lower tiers of the IG category, with 40% of debt rated BAA.
Credit quality profile (State Street)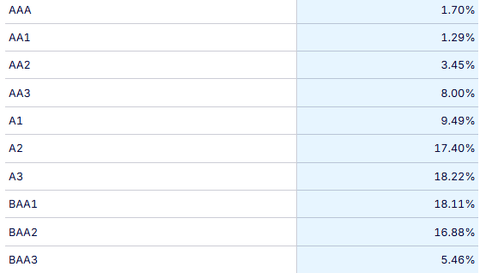
The portfolio’s average maturity is 22.2 years (versus 12.6 years for LQD), with 82% of assets above 15 years.
Maturity ladder (State Street)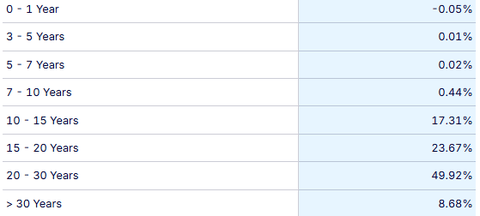
The effective duration of 11.9 years (versus 7.5 years for LQD) points to high interest rate risk. It means that asset value would change by approximately 11.9% when rates change by 1%, in the opposite direction (although that prediction is not 100% reliable).
On the upside, company-specific risk is low. The heaviest issuer, Oracle, weighs only 2%, and the top 10 names represent 16% of asset value in aggregate.
* Weights of the top 10 issuers, calculated by the author from the holding list.
Performance
SPLB has outperformed LQD by 28 bps annualized from March 17, 2009 through October 9, 2026. However, higher risk metrics (maximum drawdown and volatility in the table below) result in a lower Sharpe ratio (risk-adjusted performance). These of course will shift over time.
Data: Portfolio123
SPLB’s share price (and asset value) is close to flat since inception, as plotted below. Due to its higher duration, it has outperformed LQD in the 2009-2020 rate downtrend, then started lagging with rising rates.
SPLB vs LQD, price return since inception (Seeking Alpha)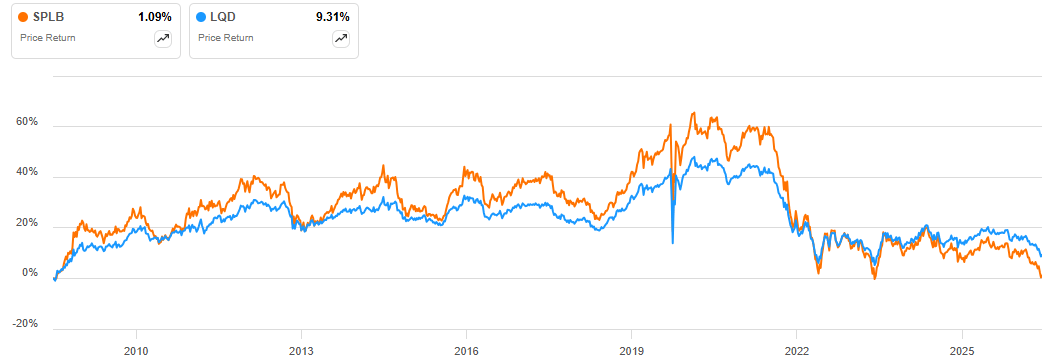
20-year Treasury yield, GS20 data series (St Louis Fed, FRED database)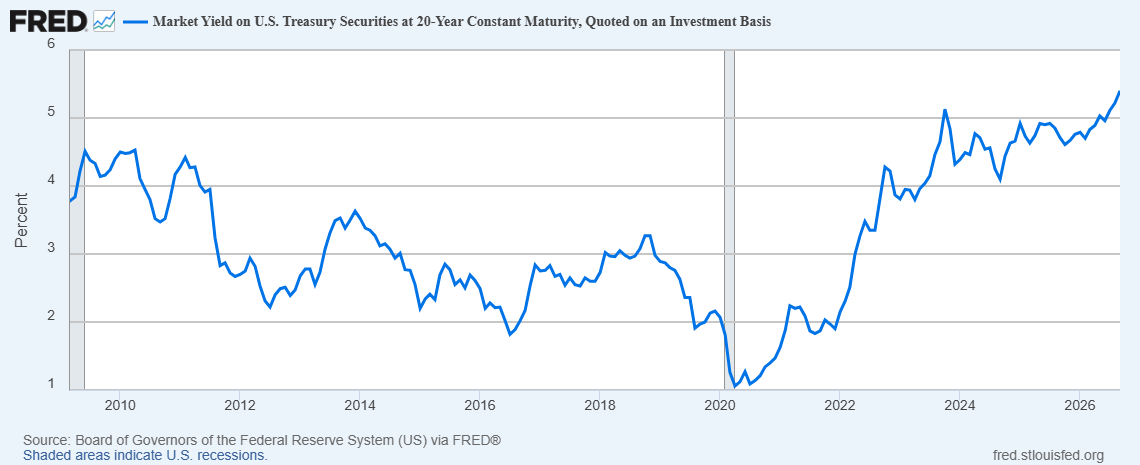
Distributions have roughly followed the rate trend. However, variations are dampened by the low turnover of the fund’s long-term bond portfolio.
Distribution history, split-adjusted (Chart: author; data: State Street)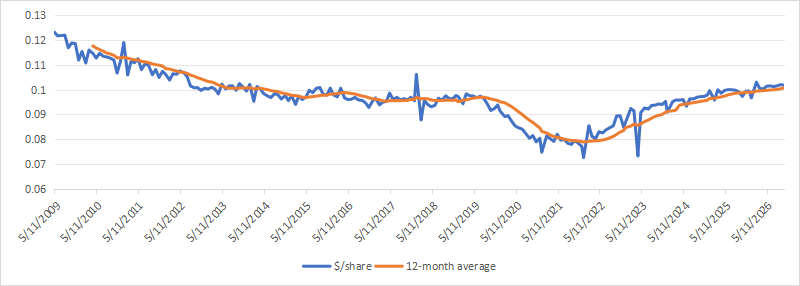
Competitors
The next table compares characteristics of SPLB and three long-term IG corporate bond ETFs:
- Vanguard Long-Term Corporate Bond ETF (VCLT)
- iShares 10+ Year Investment Grade Corporate Bond ETF (IGLB)
- iShares Interest Rate Hedged Long-Term Corporate Bond ETF (IGBH)
* Calculated with Portfolio123 from July 29, 2015 to October 9, 2026 to match inception dates.
SPLB, VCLT and IGLB have similar yields, returns and risk metrics. IGBH, which uses interest rate swaps to hedge interest rate risk and has a close-to-zero duration, is the best performer by far. It is also much less volatile, even though the hedge has not reduced the maximum drawdown in the 2020 meltdown. It’s important to remember that the hedge offsets the impact of rising rates, not of falling market sentiment.
In terms of price return, IGBH is almost unchanged from its inception, while the other funds have lost over 20%. Again, performance will change over time. This serves to illustrate them comparatively at the time of writing.
SPLB vs peers, price return since 7/29/2015 (Seeking Alpha)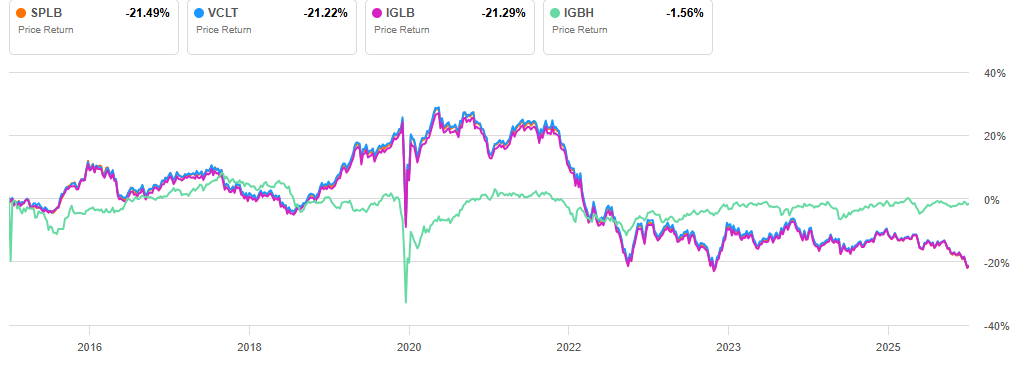
Takeaway
SPLB is well suited for investors seeking exposure to long-term corporate bonds in a stable or decreasing rate environment. When rates are rising, iShares Interest Rate Hedged Long-Term Corporate Bond ETF (IGBH) is a better alternative to preserve asset value, at the cost of a slightly lower yield.
- Pros: broad diversification, moderate financials/banks exposure, low fee.
- Cons: high interest rate risk.
This article answers these three main questions about SPLB:
- How is SPLB’s portfolio structured?
- How does SPLB compare to its benchmark and competitors?
- What type of strategies is SPLB best suited for?
Editor’s note: This article is intended to provide a general overview of the ETF for educational purposes only and, unlike other articles on Seeking Alpha, does not offer an investment opinion about the ETF.